Is This $49 Tool Better Than Google Analytics? SiteBehaviour Review
Discover SiteBehaviour, a powerful Google Analytics alternative with session recordings, heatmaps, and custom dashboards, now available as a lifetime deal on AppSumo.
Are you still searching for a worthy alternative to Google Analytics, especially after the release of GA4 left many users frustrated? Look no further. In this review, I’ll introduce you to SiteBehaviour, a powerful analytics tool available as a lifetime deal on AppSumo starting at just $49. I’ve been using this tool on my own website, and I’m excited to share my insights with you.
Introduction [00:00]
Google Analytics 4 has been a source of frustration for many users, but SiteBehaviour offers a refreshing alternative. In this review, we’ll explore its features, pricing, and how it compares to Google Analytics.
Get SiteBehaviourDashboard [00:25]
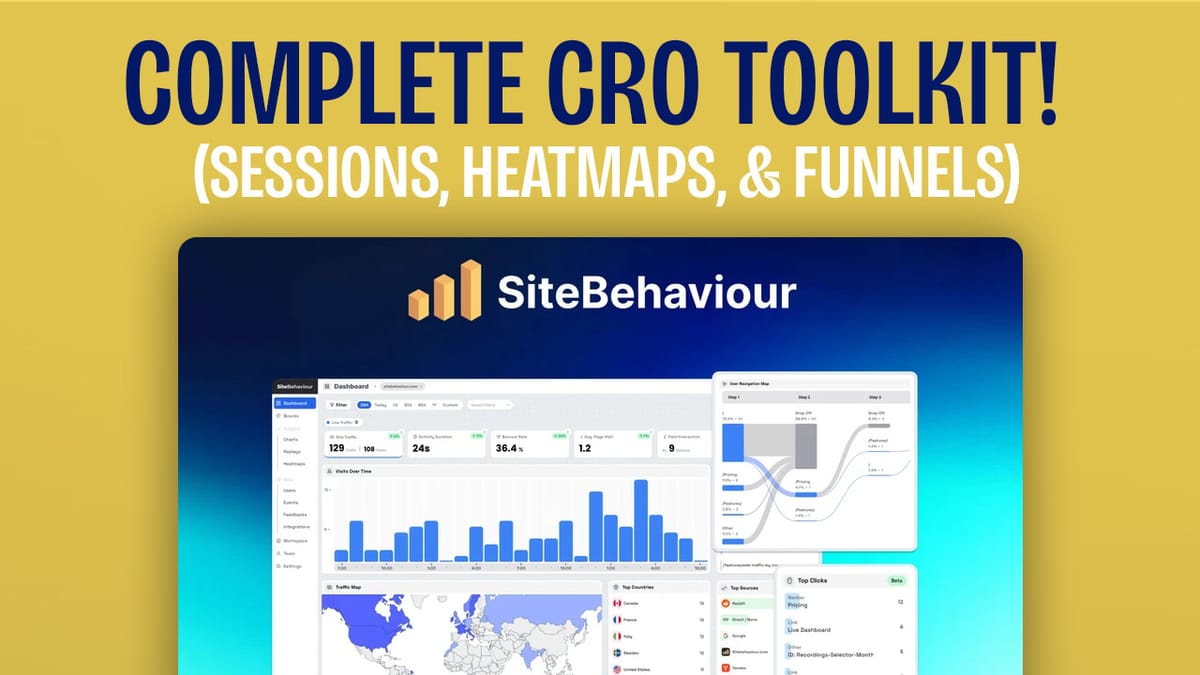
The first thing you’ll notice about SiteBehaviour is its intuitive dashboard. After adding the tracking code to my website, I immediately got access to a wealth of useful information without any additional configuration. Here’s what you can expect to see:
- Duration of visitors’ stays on your site
- Bounce rate
- Number of pages visited
- Field interaction rates
- Range of clicks (including “rage clicks”)
- Views over time
- Geographic map of visitors
- Top countries
- Referral sources
- Browser usage
- Most-clicked elements on your site
- Device types used
- User navigation map (showing the flow of visitors through your site)
What impressed me most is how actionable this information is compared to what I’ve typically gotten from Google Analytics. The best part? I didn’t have to do anything special to obtain these insights.
Site Setup [01:51]
Setting up a site with SiteBehaviour is straightforward:
- Go to the workspace section
- Click “Add a website”
- Enter your URL
- Choose whether you want complete tracking (which allows you to track user behavior over time)
- Copy the provided tracking code and paste it into your site
You can also toggle advanced tracking settings and block your own browser to prevent corrupting your data.
Workspace [02:50]
In your workspace, you can add multiple sites without any limits. However, each AppSumo LTD account gets one workspace, and billing is based on the total number of site visitors across all your sites.
Boards [03:32]
Boards in SiteBehaviour are essentially custom dashboards. You can create boards to focus on specific metrics that matter most to you or your clients. This feature is particularly useful for creating targeted reports without the distraction of unnecessary data.
Creating Charts [04:10]
To populate your boards, you’ll need to create charts. The process is user-friendly:
- Choose a chart type (count, time series, funnel, etc.)
- Set your criteria using filters
- Name and describe your chart
- Add the chart to your board
You can easily rearrange charts on your board to create the perfect custom dashboard.
Charts [05:51]
The Charts section allows you to view and manage all your created charts in one place. You can filter data by different time periods and get a quick overview of your key metrics.
Replay [06:18]
One of SiteBehaviour’s standout features is the ability to replay visitor sessions. You can see exactly what actions visitors took on your site, including:
- Pages visited
- Time spent on site
- Referral source
- Device and browser used
- Clicks and “rage clicks”
- Form entries
- Custom events
What’s particularly impressive is that each visitor gets a unique identifier, allowing you to track their behavior across multiple visits over time.
Visitors [07:46]
The Visitors section provides detailed information about individual users. While this granular data might not always be useful for making broad decisions, it can be invaluable for understanding edge cases or troubleshooting specific user issues.
Heatmap [08:47]
Heatmaps offer a visual representation of where users click and how far they scroll on your pages. This feature provides crucial insights for optimizing your site’s layout and content placement. However, it’s worth noting that heatmaps currently don’t work with Shopify or Cloudflare (though a fix is in the works).
Feedback [09:55]
SiteBehaviour includes a built-in feedback widget that you can easily enable on your site. This tool allows visitors to rate their experience and leave comments, providing you with valuable user feedback. While it’s a great feature, it would be even better if you could enable it selectively on specific pages rather than site-wide.
Events [11:39]
The Events section tracks various user interactions on your site without requiring any additional setup. This includes page clicks, form fills, and more. While the raw data might not be immediately actionable, it’s valuable for creating custom charts and reports.
Integration [12:20]
Currently, SiteBehaviour doesn’t offer many integrations, with only a Pipedrive integration in the works. While this might be disappointing for some users, the tool’s standalone capabilities are robust enough for most analytics needs.
Members [12:48]
SiteBehaviour offers unlimited team members, which is great for collaboration. However, there’s a caveat: all team members have access to all sites in your workspace. This could be an issue if you’re managing client sites and want to maintain data privacy between clients.
Plans & Pricing [14:25]
SiteBehaviour’s pricing is based on the number of site views across all your sites. The entry-level plan, which I’m using, offers 20,000 total site visitors per month for a one-time purchase of $49. Higher tiers are available, going up to 1 million visitors per month for $600.
Get SiteBehaviourConclusion [15:01]
After thoroughly testing SiteBehaviour, I’m giving it a solid 7.8 out of 10. Here’s why I believe it’s a strong contender in the analytics space:
- Easy to use: You get actionable data right out of the box without complex setups.
- Comprehensive features: Includes session recordings, heatmaps, and custom dashboards.
- Affordable: The lifetime deal pricing is extremely competitive, especially when compared to the costs of hosting and maintaining open-source alternatives like Matomo.
While there are other analytics options out there, including open-source tools and monthly services, I haven’t found any that offer this combination of ease of use, feature set, and affordability.
If you’re looking for a powerful, user-friendly alternative to Google Analytics, SiteBehaviour is definitely worth considering. The AppSumo lifetime deal makes it an even more attractive option for budget-conscious entrepreneurs and small businesses.
Remember, if you decide to purchase SiteBehaviour or any other tool through AppSumo, consider using my affiliate link in the description. Your support helps make these daily LTD reviews possible.
For more tech reviews and insights, don’t forget to subscribe to my channel and sign up for my free email newsletter at clientamp.com. Thanks for reading, and I’ll see you in the next review!